
Figure 4.
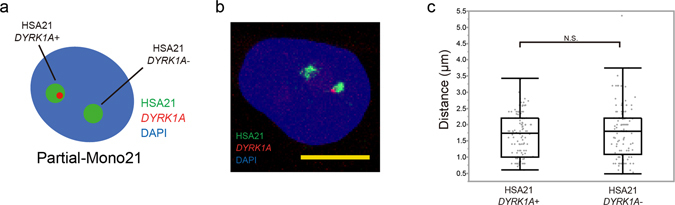
Chromosome positioning of chromosome 21 in Partial-Mono21 iPSCs. (a) A schematic of 3D-FISH analysis in Partial-Mono21 iPSCs. Two copies of chromosome 21 (green) can be distinguished each other by co-labelling with a DYRK1A probe (red). (b) Representative 3D-FISH images of Partial-Mono21 iPSCs. Chromosome 21 was labelled with Alexa488 (green), while the DYRK1A gene was labelled with Cy3 (red). Nuclei were stained with DAPI. Scale bars represent 10 μm. (c) The distance from chromosome 21 to the nearest nuclear membrane in Partial-Mono21 iPSCs (n = 120). Box plot represents 25th–75th percentile range ± min–max. p values were determined by the Mann–Whitney U test. *p < 0.05, **p < 0.01.