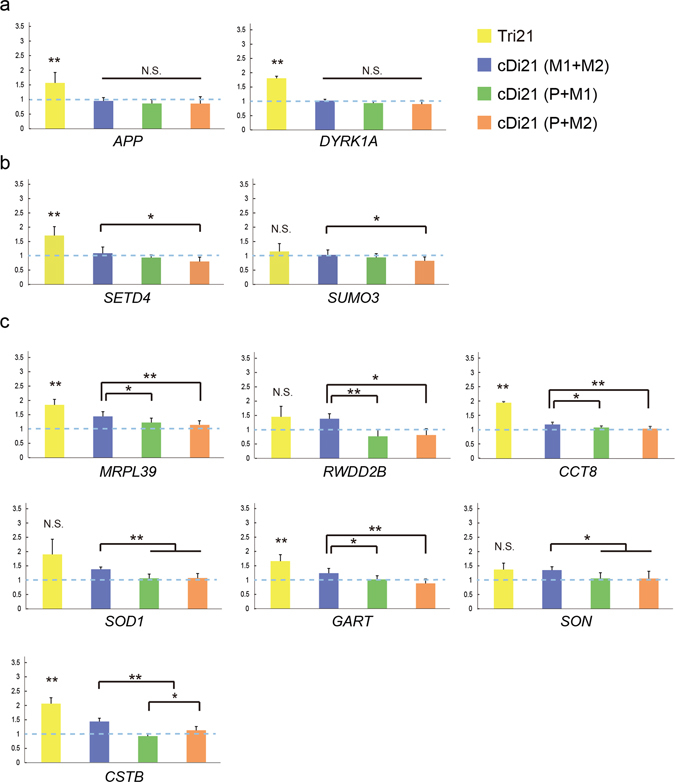
Figure 5.

Gene expression analysis in Tri21 and cDi21 iPSCs. Relative expression levels of genes on chromosome 21 in Tri21 (yellow, n = 3), cDi21(M1 + M2) (blue, n = 9), cDi21(P + M1) (green, n = 9) and cDi21(P + M2) (orange, n = 9) iPSCs. Gene expression was normalised to that of Di21. (a) Genes whose expression levels did not differ markedly between cDi21 iPSCs (see also Supplementary Fig. S5). (b) Genes whose expression levels were higher in cDi21(M1 + M2) than in cDi21(P + M2) (see also Supplementary Fig. S6). (c) Genes whose expression levels were higher in cDi21(M1 + M2) than in cDi21(P + M1) and cDi21(P + M2). Error bars represent SEM. p values were determined by Student’s t-test or the Mann–Whitney U test. *p < 0.05, **p < 0.01.
