Figure 3.

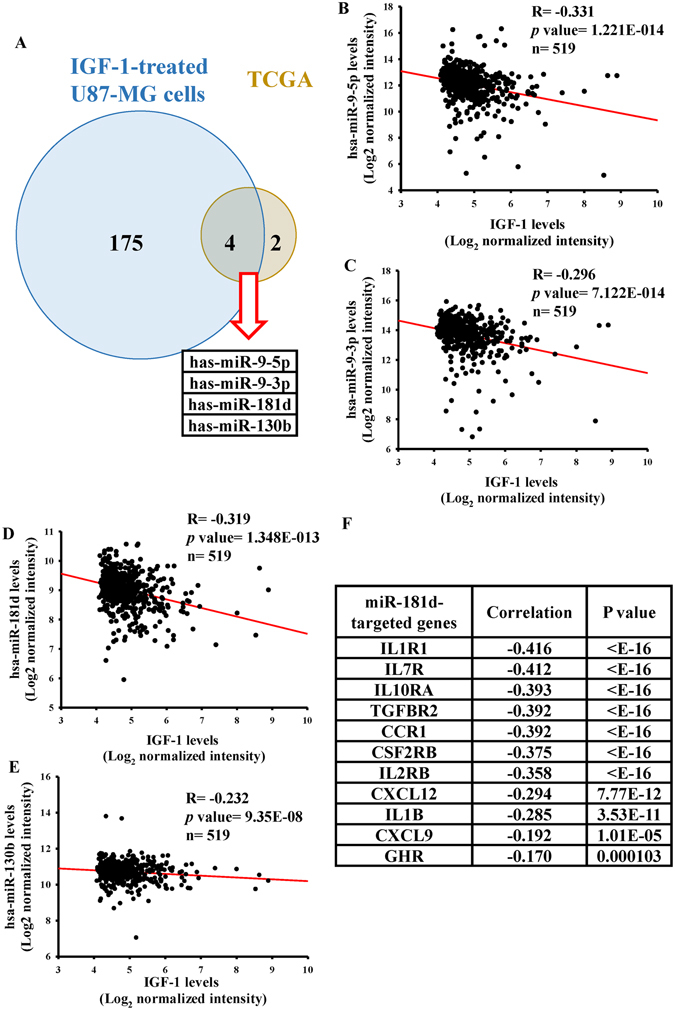
Identification of insulin-like growth factor (IGF)-1-mediated micro (mi)RNA signature by in silico and in vitro analyses. (A) The Venn diagram shows that four candidate miRNAs were identified in both TCGA miRNA array and IGF-1-treated U87-MG miRNA array data. Six and 179 IGF-1-downregulated miRNAs were respectively obtained from 312 TCGA miRNA arrays of GBM patients with different IGF-1 levels and the miRNA array analysis with 200 ng/ml IGF-1-treated U87 MG cells for 48 h (with a multiple of change (MC) of <0.75 and a false discovery rate (FDR) of <0.05). The four candidate miRNAs were identified in both miRNA array datasets. Expression correlations between IGF-1 and IGF-1-downregulated miRNAs included miR-9-5p (B), miR-9-3p (C), miR-181d (D), and miR-130b (E) in TCGA GBM data (n = 519). The correlations were measured by Spearman’s correlation analyses. (F) The list shows 11 putative target genes of miR-181d with an inverse correlation.
