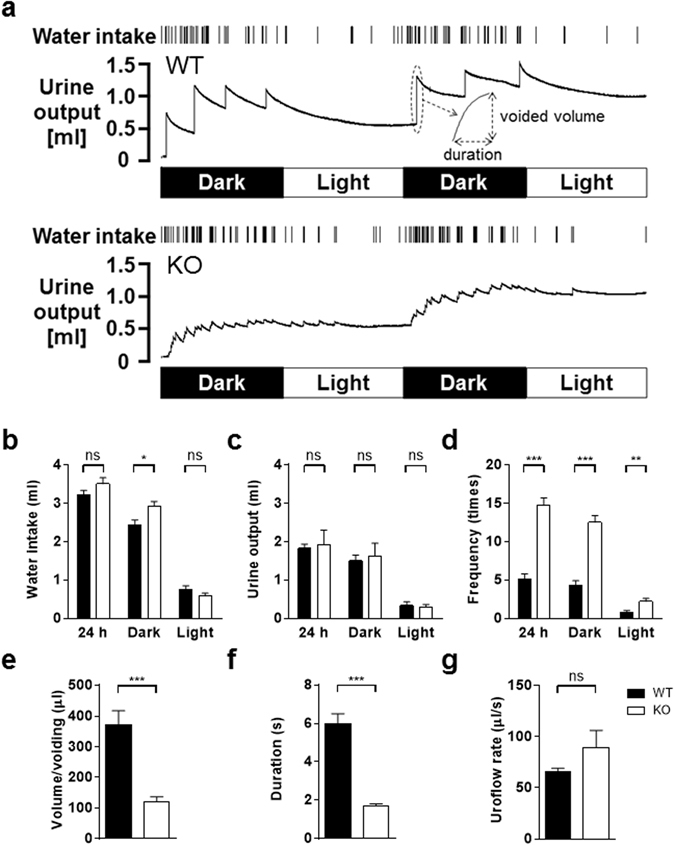
Figure 2.

Analysis of voluntary voiding behaviour in metabolic cages. (a) Representative 48-h recording charts showing water intake and urine output of a WT mouse (top) and a P2Y6-KO mouse (bottom). Data interpretations are described in a previously published article20. Note that the KO mouse had a much higher voiding frequency and remarkably smaller urine volume/voiding compared with the WT mouse. Bar graphs showing quantitative analysis of metabolic cage experiments for water intake (b), urine output (c), voiding frequency (d), urine volume/voiding (e), voiding duration (f), and mean uroflow rate (g). Data are presented as the mean ± SEM. WT (n = 10) and P2Y6-KO (n = 10) mice were compared by unpaired t-test. *P < 0.05; **P < 0.01; ***P < 0.001; ns, not significant.
