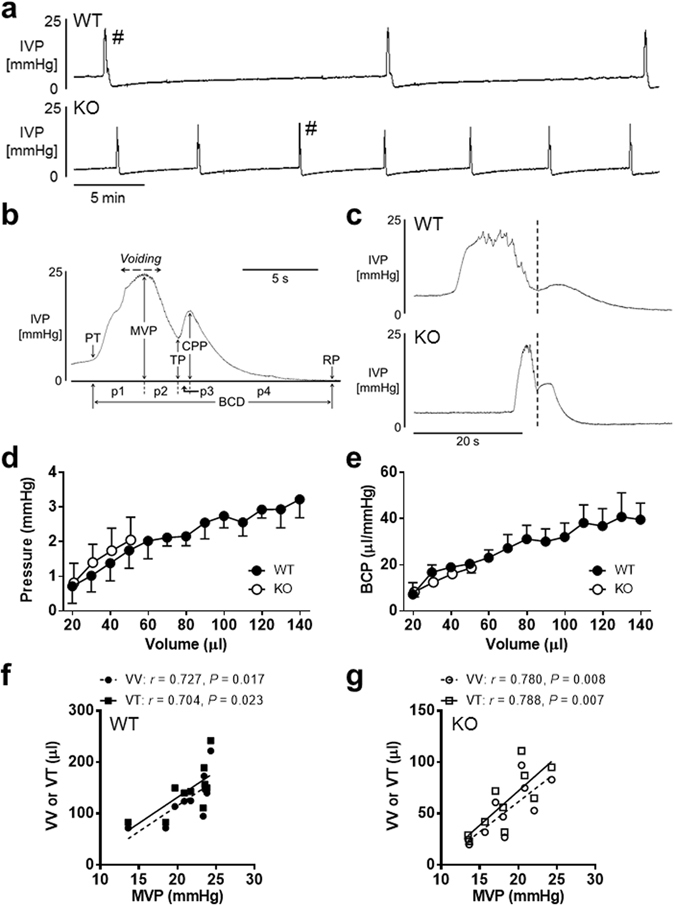
Figure 3.

Cystometry analysis of reflex micturition cycle under decerebrate unanaesthetized conditions. (a) Bladder activity was recorded during continuous saline infusion cystometry (infusion rate: 10 µl/min). Note that, compared with a WT mouse (top), a P2Y6-KO mouse (bottom) presents increased frequency of micturition. A bladder contraction was evaluated in detail as indicated in (b). PT, pressure at volume threshold for micturition contraction; MVP, maximal voiding pressure; TP, trough pressure; CPP, closing peak pressure; RP, post-void resting pressure; BCD, bladder contraction duration; p1, p2, p3, and p4 are 1st, 2nd, 3rd, and 4th phases of BCD, respectively. (c) A comparison of a WT mouse (top) and a P2Y6-KO mouse (bottom), both of which were extracted from micturition contractions with the symbol (#) in (top) and (bottom), respectively, showed that a contraction duration of the P2Y6-KO mouse is markedly shorter than that of the WT mouse. A dotted line divides a bladder contraction into the 1st phase duration and 2nd phase duration24. Pressure-volume relationship (d) and bladder compliance (BCP)-volume relationship (e) of WT and P2Y6-KO mice showed no difference between the 2 groups (by repeated measures two-way ANOVA) and indicate a linear regression in the relationships (Y = 0.01928X + 0.6188 and Y = 0.2527X + 7.658, respectively, for WT; Y = 0.04046X + 0.08669 and Y = 0.3496X + 1.633, respectively, for P2Y6-KO). These relationship graphs were constructed using animals that completed values of 20 µl to 140 µl for WT and 20 µl to 50 µl for P2Y6-KO (n = 6 for each group). Coefficients (r) and P values (P) between MVP and VV or VT for WT (f) and P2Y6-KO (g) are shown (n = 10 for each group), based on the calculation by Spearman’s correlation analysis and by Pearson’s correlation analysis, respectively. VV, voided volume; VT, volume threshold for micturition contraction.
