


Figure 4.
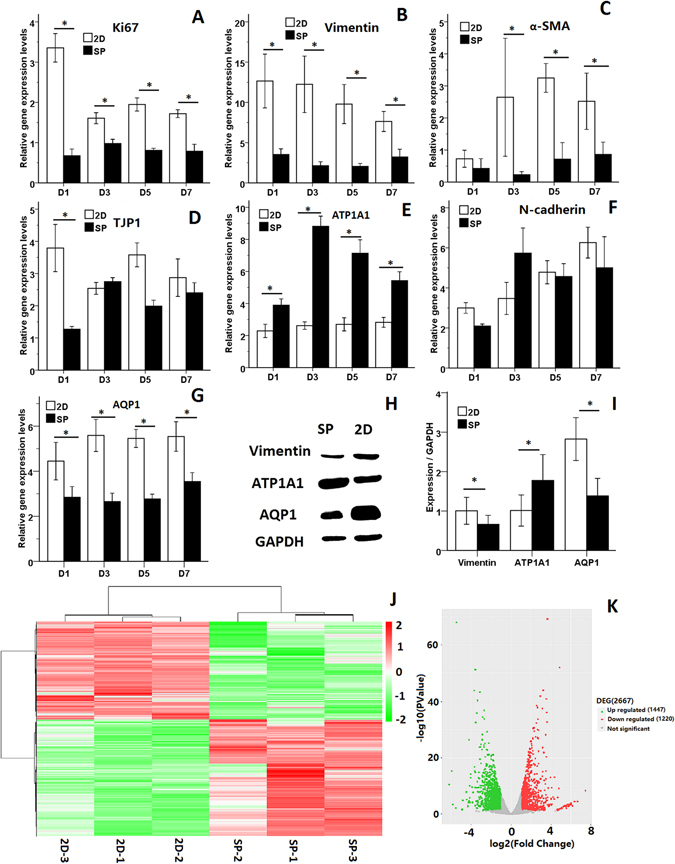
Impediment of EMT in CECs by biomimetic platforms of CEC spheroids. (A–G) QPCR analysis of proliferation marker and functional marker expression normalized to GAPDH. (H) WB of vimentin, ATP1A1, AQP1 and GAPDH in 2D and SP cultures. (I) Quantification of protein expression levels by Western blotting using Image J software. Differences with *P < 0.05 were considered statistically significant. (J) Hierarchical cluster analysis of gene expression based on log ratio RPKM data. (K) Differences in the gene expression profiles of 2D and SP cultures.