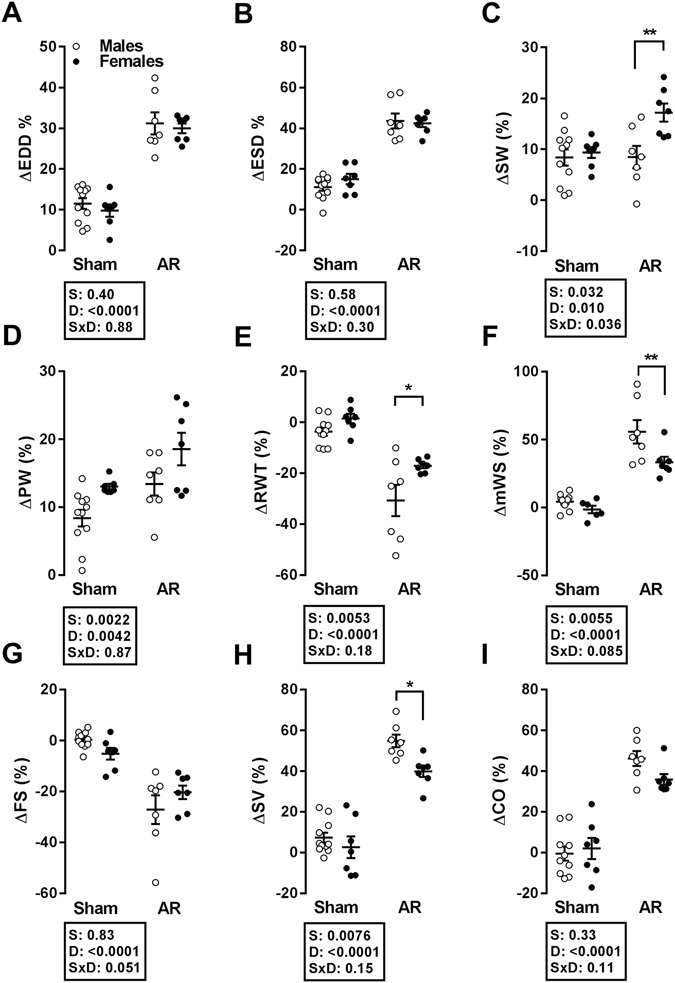
Figure 1.

Progression of different LV parameters as evaluated by echocardiography during the duration of the study (26 weeks). Δ: % difference between week 0 and week 26, EDD: end-diastolic diameter (A), ESD: end-systolic diameter (B), SW: septal wall thickness (C), PW: posterior wall thickness (D), RWT: relative wall thickness (E), mWS: mean wall stress (F), FS: fractional shortening (G), SV: stroke volume (H) and CO: cardiac output (I). The results are reported in % as the mean ± SEM (n = 7–11/gr). Probability values from a 2-way ANOVA and Holm-Sidak post-testing to evaluate the p value of sex, (S), disease (D) or disease-sex interactions (S × D) are shown next to each panel.
