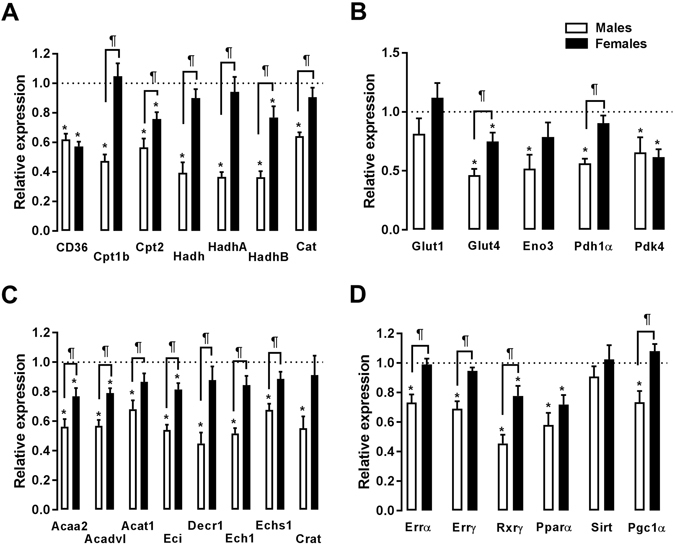
Figure 5.

Evaluation by real-time quantitative RT-PCR of the LV mRNA levels of genes encoding for enzymes implicated in fatty acid oxidation (left panels; A and C) and glycolysis (top right panel; B) and for transcription factors related to bioenergetics control (right bottom panel; D). The results are reported in arbitrary units (AU) as the mean ± SEM (n = 5–6/gr.). The mRNA levels of the sham (sham-operated animals) groups (ShM and ShF) were normalized to 1 and are represented by the dotted line. White columns represent the ArM group, and black columns represent the ArF group. *p < 0.05 vs. the corresponding sham group and ¶p < 0.05 between the ArM and ArF groups.
