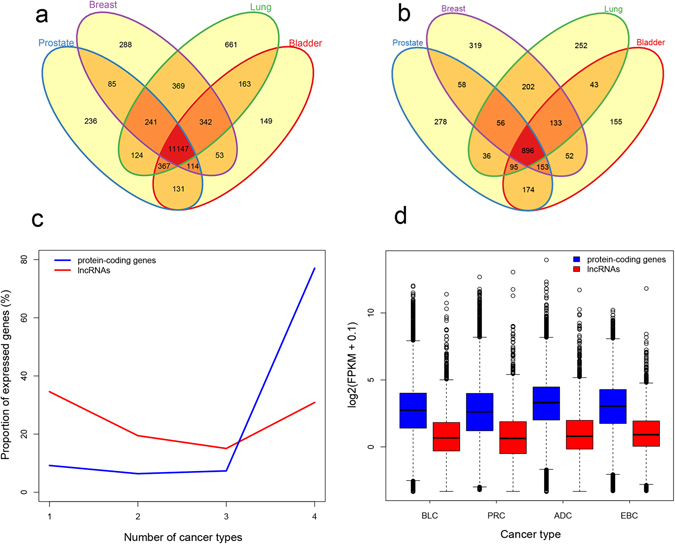
Figure 1.

Distributions and expression levels of expressed genes in the four cancer types. The venn plot of 14,470 expressed protein-coding genes (a) and 2,902 expressed lncRNA genes (b). (c) The proportion of expressed protein-coding genes (blue) and lncRNA genes (red) appearing in different number of cancers. The x axis depicts the number of cancer types. The y-axis depicts the proportion of expressed genes, which is the ratio between the counts of expressed genes appearing in different number of cancers and the total counts of all expressed genes. (d) The expression levels (log2(FPKM + 0.1)) of expressed protein-coding genes (blue) and lncRNAs (red) in each cancer type.
