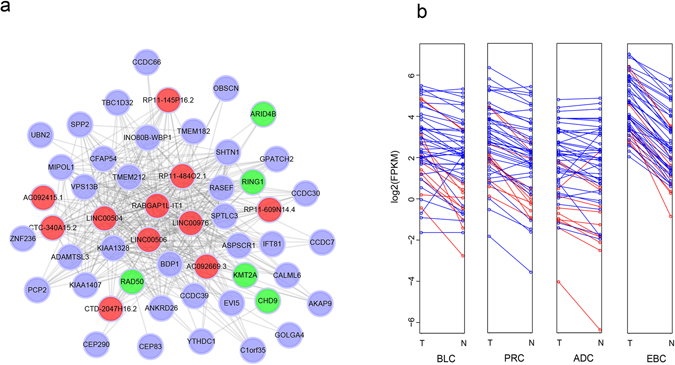
Figure 5.

Network and expression levels of 51 top hub genes in brown module. (a) Cytoscape network visualization of 51 genes, in which only edges with weight (w) above a threshold of 0.2 are displayed. The red nodes denote lncRNA genes. The green and blue nodes both denote protein-coding genes, but the green color stands for genes with function in maintaining genomic stability. (b) The expression levels of 51 genes in each cancer type. The y axis represents the average FPKM value of samples in each group. And the blue and red colors denote protein-coding genes and onco-lncRNAs, respectively.
