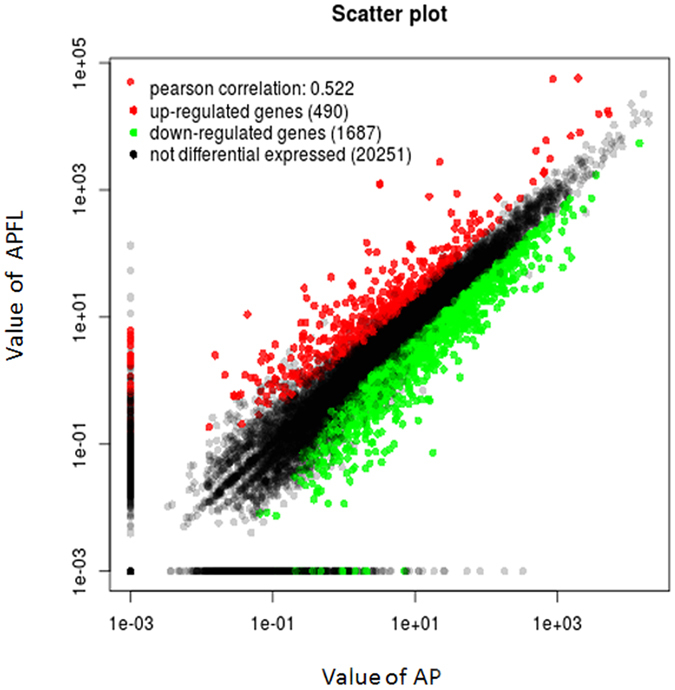
Figure 3.

Differentially expressed genes between APFL and AP. Red spots represented up-regulated genes, and green spots down-regulated genes. Black spots indicate genes that were not differentially expressed between the two samples.

Differentially expressed genes between APFL and AP. Red spots represented up-regulated genes, and green spots down-regulated genes. Black spots indicate genes that were not differentially expressed between the two samples.