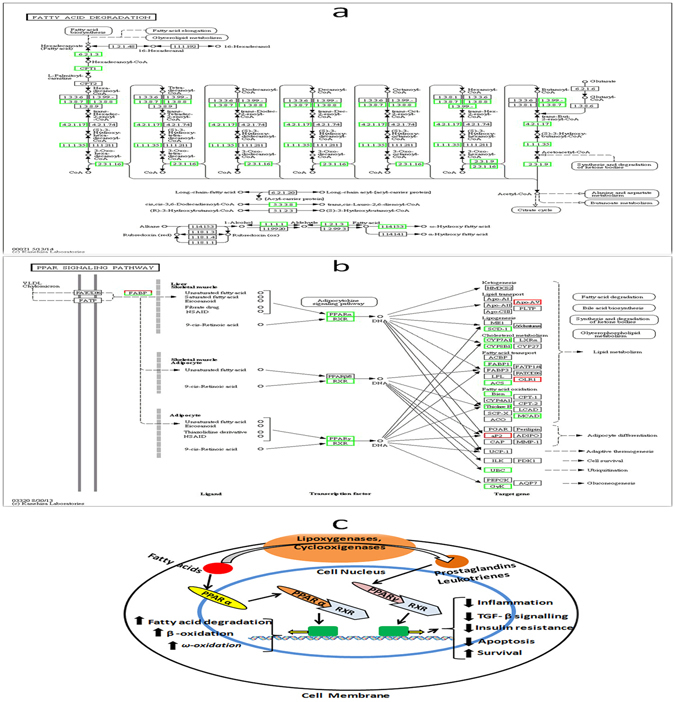
Figure 6.

DEGs related to fatty acid degradation and PPARα signaling pathway between APFL and AP. KEGG pathway maps for (a) fatty acid degradation pathway (ko00071) and (b) PPARα signaling pathway (ko03320)49. Up-regulated genes are marked with red borders and down-regulated genes with green borders. Non-change genes are marked with black borders. Physiological function of the peroxisome proliferator activated receptors (PPARs) is shown in (c).
