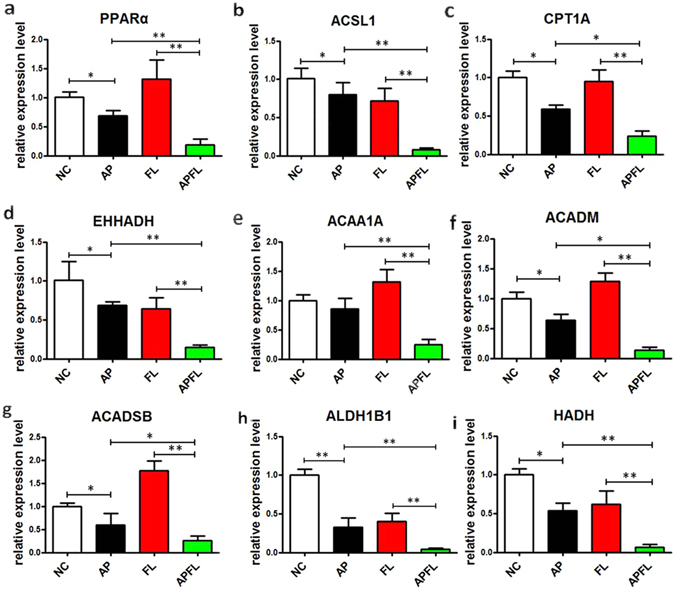
Figure 8.

Quantitative RT-PCR validation of the selected dysregulated genes associated with fatty acid degradation. The expression levels of PPARα (a), ACSL1 (b), CPT1A (c), EHHADH (d), ACAA1A (e), ACADM (f), ACADSB (g), ALDH1B1 (h) and HADH (i) in NC, AP, FL and APFL were validated using qRT-PCR. The bar graph shows the expression of each gene in AP, FL, APFL relative to the average expression levels in NC. All error bars indicated S.D. *P < 0.05 vs NC, **P < 0.01 vs NC, # P < 0.05 vs FL.
