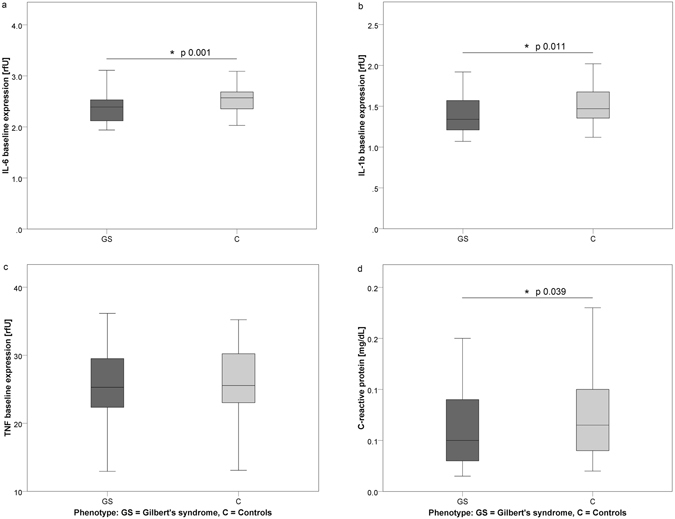
Figure 1.

Differences in the inflammatory status between GS and C individuals (all subjects). Figure 1 (a–d) illustrates inter-group differences in the inflammatory parameters of intracellular IL-6, IL-1β, TNFα and circulating CRP (Phenotype: GS: dark grey, C: light grey). Abbreviations: IL-6/IL-1β: intracellular interleukins 6/1β; TNFα: intracellular tumor necrosis factor; CRP: circulatory C-reactive protein; GS: Gilbert’s syndrome; C: control subjects. *Indicates significant difference on a 5% level of error.
