Figure 2.

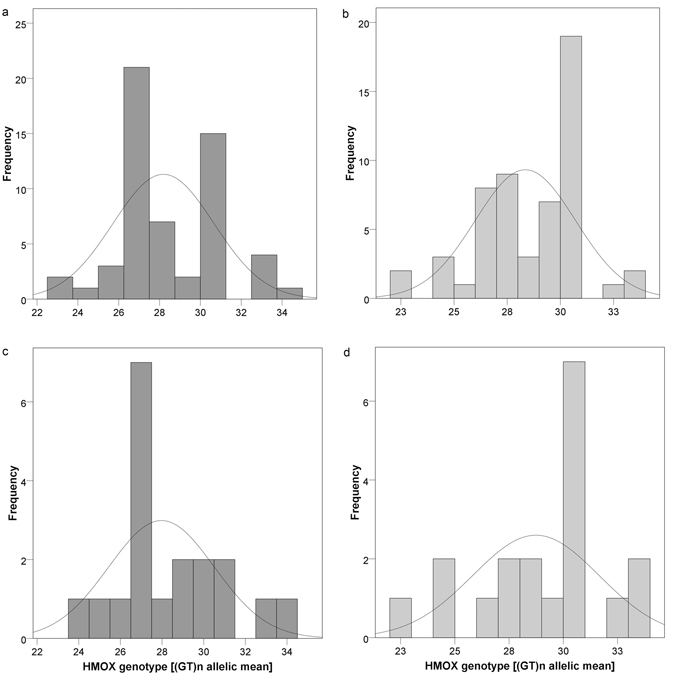
(a–d) Histograms showing frequency of HMOX-genotypes (classified as SS, SM, SL, MM, ML) stated in the BiliHealth study population. Figure 2 shows statistical distribution and frequency of respective HMOX-genotypes, expressed as (GT)n allelic mean, between the study groups. (a and b) Male and female (all) subjects (Phenotype: GS: dark grey; C: light grey). (c and d) Female subjects only (Phenotype: GS: dark grey; C: light grey). Data distribution proposes a non-significant higher abundance of SM alleles in GS individuals, whereas the MM variant appeared to be more prominent in C subjects. This non-significant observation suggests a (gender-specific) higher frequency of shorter GT-repeats in GS individuals, which would be worth pursuing in a larger study collective. Classification of GT-fragment lengths (S < 26, L > 30) was performed following Chang et al.72.
