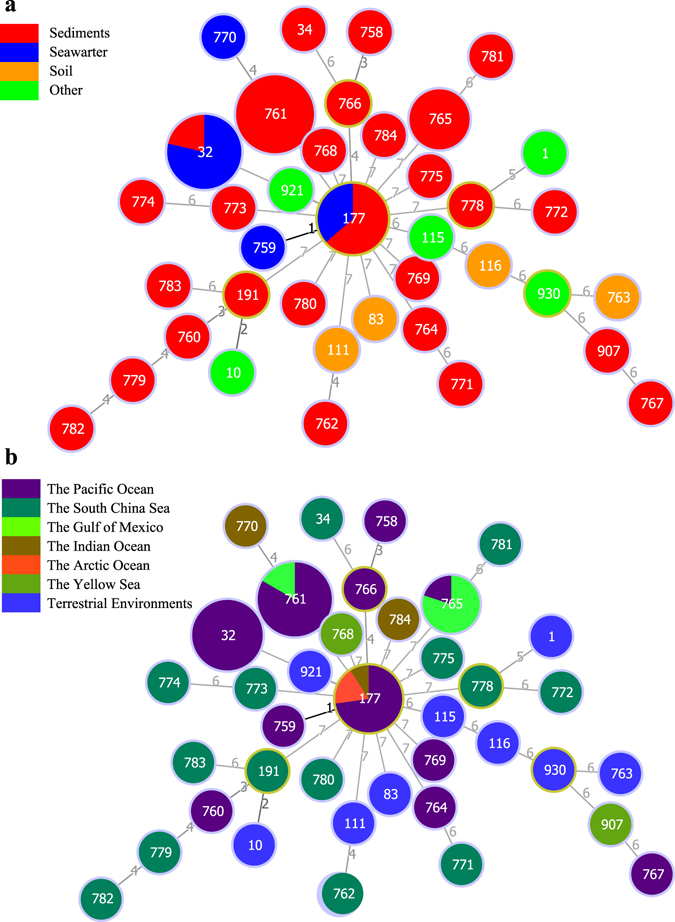
Figure 1.

Minimum spanning tree reflecting clonal relationships of sequence types (STs) for 82 B. cereus group bacteria constructed using goeBURST. Each ST is represented by a circle, and the size of the circle is logarithmically proportional to the number of strains represented by the ST. Exact numbers of isolates per ST are given in Supplementary Table S1. The numbers connecting the circles indicate the number of genes of difference genes between isolates. (a) The isolates are colored according to isolated samples, as given in the key at upper left. (b) The isolates are colored according to isolated areas, as given in the key at middle left.
