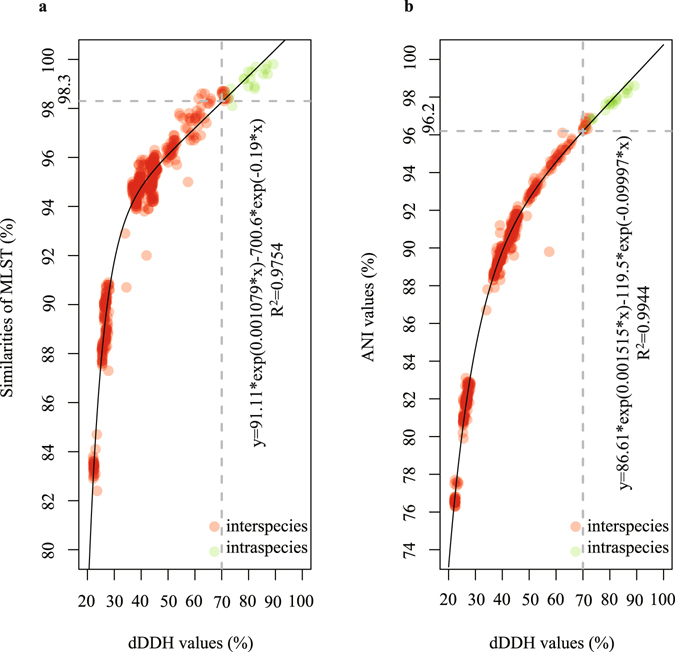
Figure 3.

Correlation analyses between the dDDH values and MLST similarities, dDDH and ANI values for 32 strains within this group. The vertical line indicates a 70% dDDH threshold. (a) The horizontal line (y = 98.3) indicates the estimated MLST similarity threshold (inter-species) corresponding to 70% dDDH threshold, as given in the key at left. (b) The horizontal line (y = 96.2) indicates the estimated ANI threshold (inter-species) corresponding to 70% dDDH threshold, as given in the key at right.
