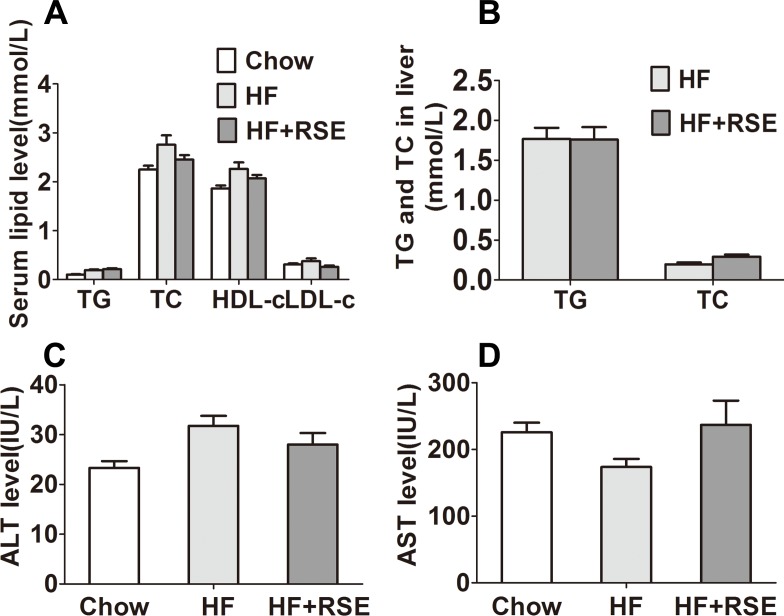
Figure 4. Effects of RSE on serum and liver lipid levels in high-fat-diet-induced C57BL/6 mice.
(A) Serum TC, TG, HDL-c, LDL-c levels (B) Liver TG and TC levels (C) ALT levels in serum (D) AST levels in serum. Data are presented as mean ± SEM (Chow: n = 10; others: n = 8), figure B comparison between group pairs were K–W H test because the data didn’t follow normal distribution. ∗P < 0.05, ∗∗P < 0.01 vs the HF group.

