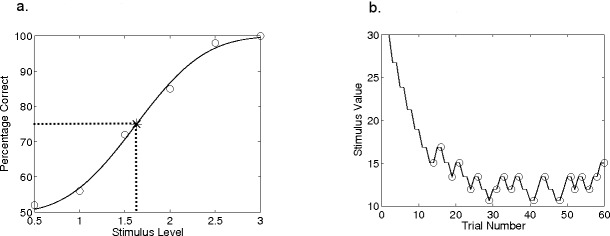
Figure 1. Hypothetical psychophysical data.
Data from a hypothetical psychometric function (A) and an adaptive procedure-track (B). In (A), the data showing percentage of correct responses for six stimulus values have been fit with a Weibull function; dashed lines show the intersection of threshold and the 75%-correct point on this function. In (B), the procedure terminates after 20 reversals, indicated by circles.

