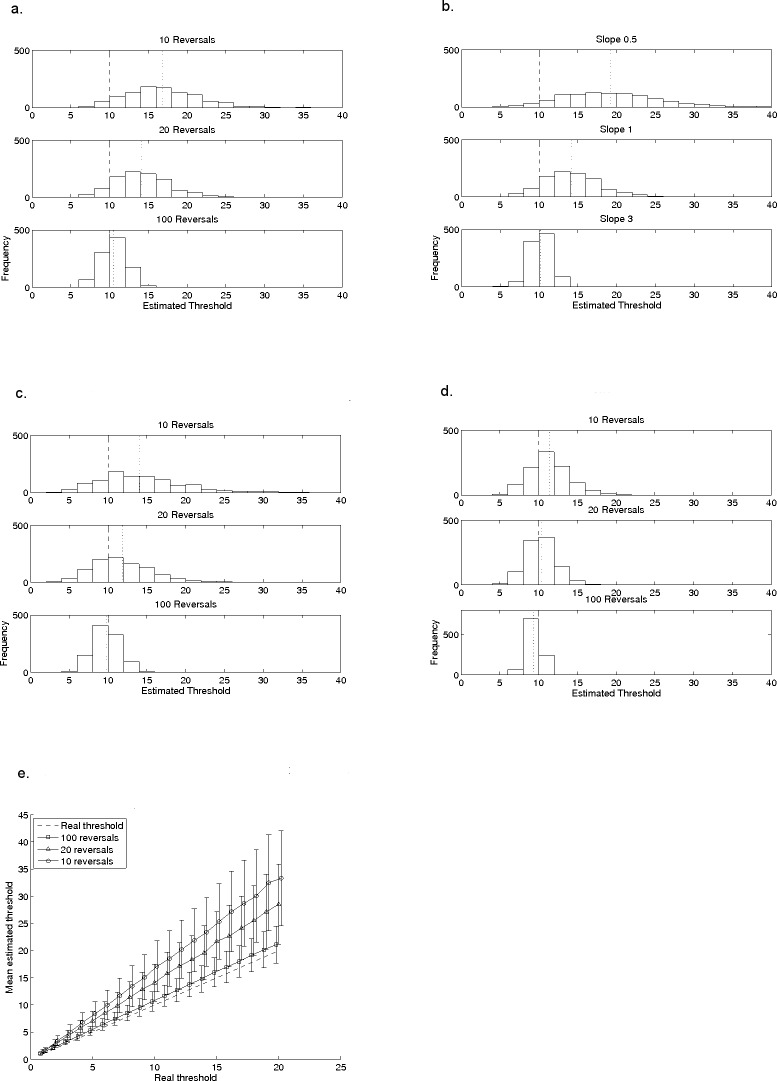
Figure 2. Effects of reversal-count, slope, step-size, and adjustment rule on a typical staircase procedure.
The effects of reversal count (2A), slope (2B) and step-size (2C) on the mean and variability of thresholds measured with a 2-down, 1-up procedure. In all plots, the model subject had a known and fixed threshold of 10, indicated by the dashed line; the dotted line indicates the mean of the estimated thresholds. In (A), data are shown for 10, 20 and 30 reversals when the model subject had a fixed slope (β) of 1, for a 2-down, 1-up (1 dB) adaptive procedure. In (B), data are for 20 reversals with the same 2-down, 1-up procedure but the value of β is either 0.5, 1, or 3. In (C), all parameters are the same as in (A) but the step-size of the adaptive procedure is 2 dB instead of 1 dB. (D) illustrates the different relationship with reversal-count when the adjustment rule is changed, in this case to a 3-down, 1-up (1 dB) procedure. (E) shows mean thresholds, estimated by the 2-down, 1-up (1 dB) adaptive procedure, for a set of model subjects with a range of thresholds between 1 and 20 (β = 1). Their real thresholds are plotted against mean estimated thresholds based on 10, 20 and 100 reversals. The error bars indicate ±1 standard deviation in the estimated threshold. Points are artificially offset from each other to facilitate interpretation of the error bars.

