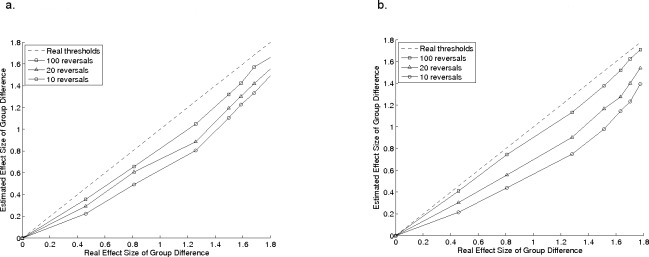
Figure 3. Group comparisons.
Effect-sizes for group comparisons for estimated thresholds in a group of model observers, plotted as a function of the effect size for the same comparisons using their real thresholds, for a 2-down, 1-up procedure 3A and a 3-down, 1-up procedure 3B. Error bars show standard deviation.

