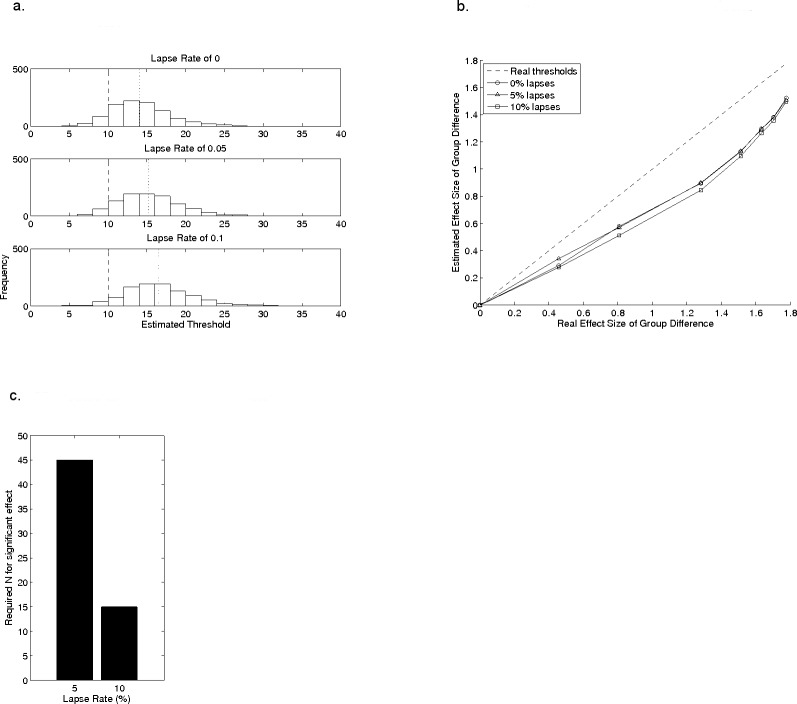
Figure 4. The effects of lapse rate on estimated threshold.
(A) shows histograms of estimated thresholds, taken from 20 reversals, for a single model observer with a real threshold of 10 (β = 1), with different lapse rates. The data for the lapse rate of 0% in (A) are the same data as in the 20 reversals section of Fig. 2A. (B) shows the effect of lapse rate on mean estimated threshold across the same groups of model observers as in the reversal-count analysis from Fig. 3. (C) illustrates the group-sizes that would generate an artificial group difference for groups with lapse rates of 5% or 10%, even when veridical thresholds in both groups were identical, using the data in (A).

