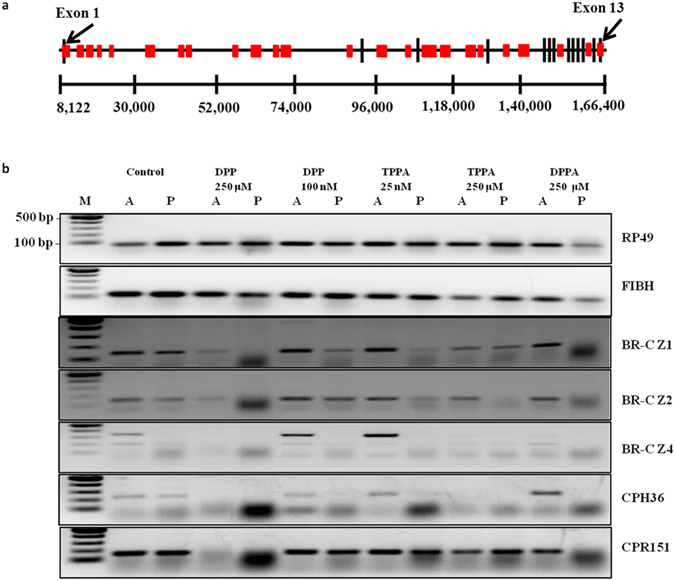
Figure 4.

TTAGG enriched BR-C gene and its transcription along with other TTAGG genes. (a) A schematic representation of BR-C gene. The exons and introns are indicated. The red boxes indicate 5′-TTAGG-3′ repeats. Lines connect the actual order of the exons. TTAGG repeats are not to scale. (b) RT-PCR data for expression of RP49, FIBH, broad-complex isoforms (BR-C Z1, BR-C Z2, BR-C Z4) and putative cuticle protein genes (CPH36 and CPR151). ‘A’ and ‘P’ denote anterior and posterior silk gland.
