
Figure 1.
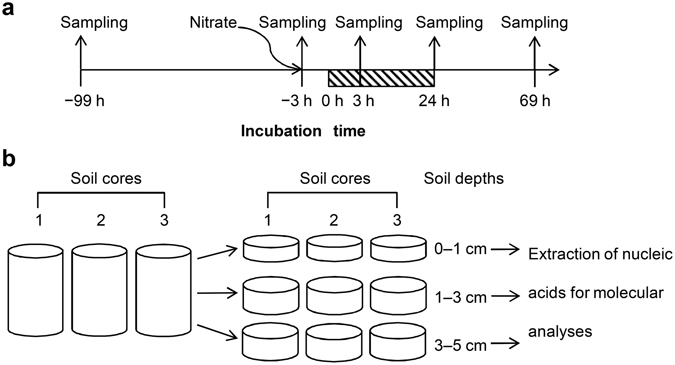
Sampling time (a) and dissection (b) of soil cores. The shadowed region indicates the waterlogging period. Arrows indicate the time of soil sampling and addition of nitrate.
Official websites use .gov
A
.gov website belongs to an official
government organization in the United States.
Secure .gov websites use HTTPS
A lock (
) or https:// means you've safely
connected to the .gov website. Share sensitive
information only on official, secure websites.
Sampling time (a) and dissection (b) of soil cores. The shadowed region indicates the waterlogging period. Arrows indicate the time of soil sampling and addition of nitrate.