
Figure 2.
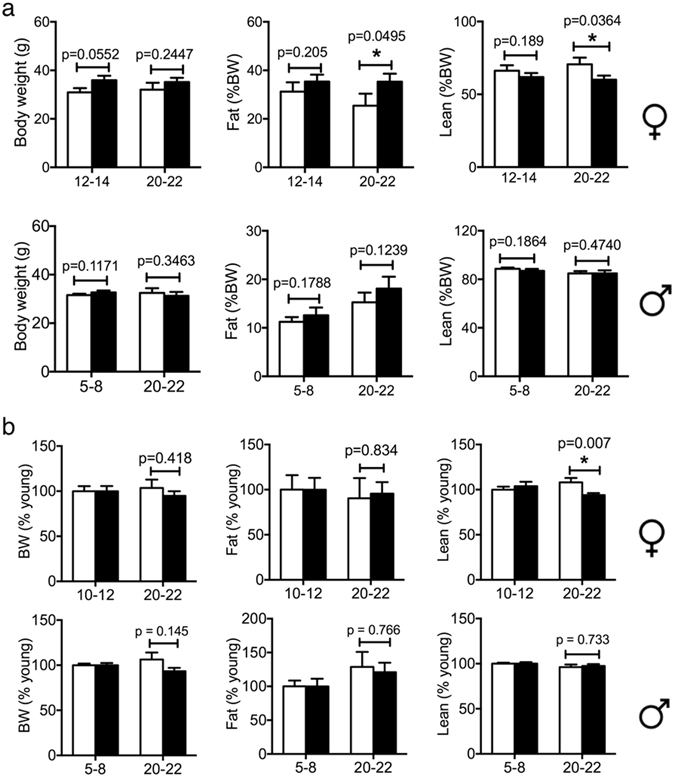
Body weight and composition. Body weight and composition of mice at different ages (specified in the figure) were determined using magnetic resonance imaging approach as described in the method section. (a) Body weight, lean and fat mass to body weight ratio. (b) Body weight, lean and fat mass normalized to young mice with the same gender and genotype. Male: 5–8 m mice, n = 17 for WT, n = 13 for TSC1 tg; 20–22 m mice, n = 18 for WT, n = 10 for TSC1 tg. Female: 12–14 m mice, n = 14 for WT, n = 15 for TSC1 tg; 20–22 m mice, n = 12 for WT, n = 19 for TSC1 tg. The asterisks indicate statistical significance between Tsc1 tg and wild type mice (*p < 0.05).