
Figure 7.
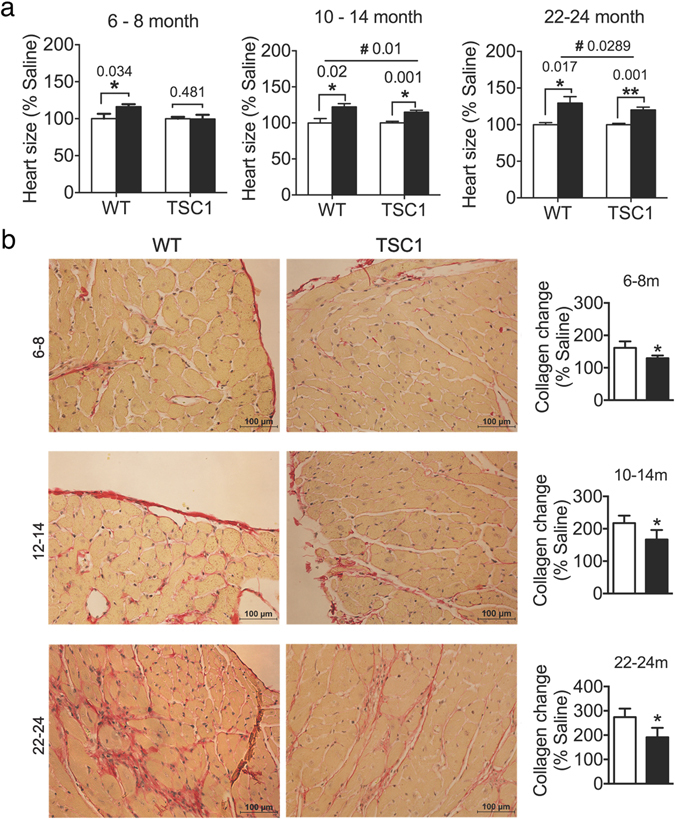
Cardiac function analysis after isoproterenol injection. (a) Heart size (ratio to body weight) in young (6–8 month, n = 8 for each group), middle aged (10–14 months, n = 8 WT, n = 12 TSC1 tg), and old (22–24 months, n = 13 WT, n = 15 TSC1 tg) female mice before and after isoproterenol challenge. White bar – mice with saline; black bar – mice with isoproterenol injection. Asterisks (*p < 0.05 and **p < 0.01) indicate statistical significance between isoproterenol injected mice and saline injected mice. Ampersand (#p < 0.05) indicates statistical significance in the degree of hypertrophy after isoproterenol injection between Tsc1 tg mice and wild type mice. (b) Histological examination of left cardiac tissue from young (6–8 month), middle aged (12–14 month), and old (22–24 month) female mice using Picrosirius Red Staining as described in the method section (n = 6 mice in each group). Collagen content changes during hypertrophy were calculated as a percentage of collagen content after isoproterenol against saline injected mice of the same genotype. Asterisks (*p < 0.05) indicate statistical significance between Tsc1 tg mice and wild type mice.