
Figure 8.
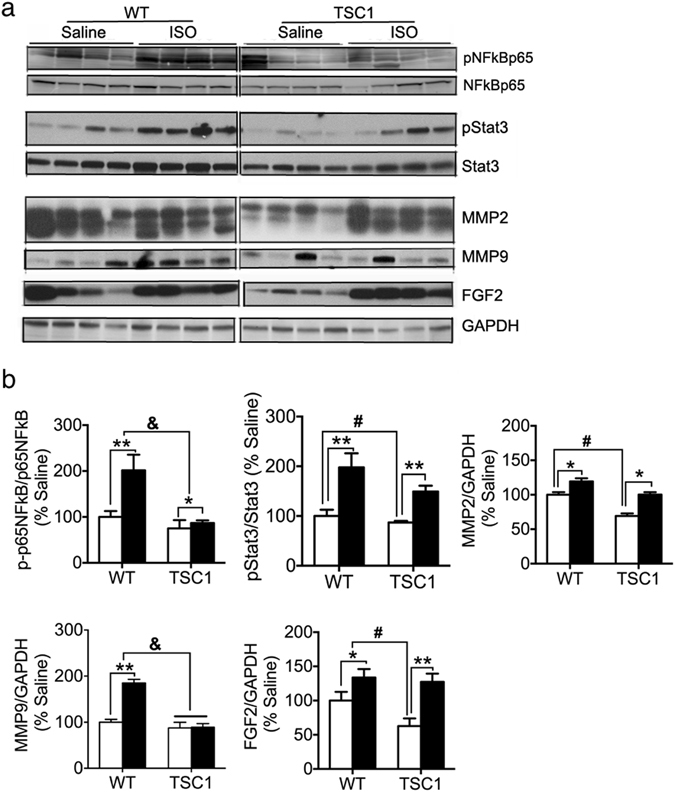
Fibrosis and inflammatory response in the heart of aged mice and the heart of mice after isoproterenol challenge. (a) Western blot analysis of NFκB, Stat3, FGF2 and MMP2/9 in heart protein extracts from old female mice (22–24 months of age, n = 6). (b) Quantification of protein band intensity (n = 6). WT – wild type mice; TSC1 - Tsc1 tg mice. White bar – saline-injected mice; black bar – isoproterenol-injected mice. Asterisks (*p < 0.05 and **p < 0.01) indicate statistical significance between isoproterenol injected and saline injected mice of the same genotype as indicated in the graph.