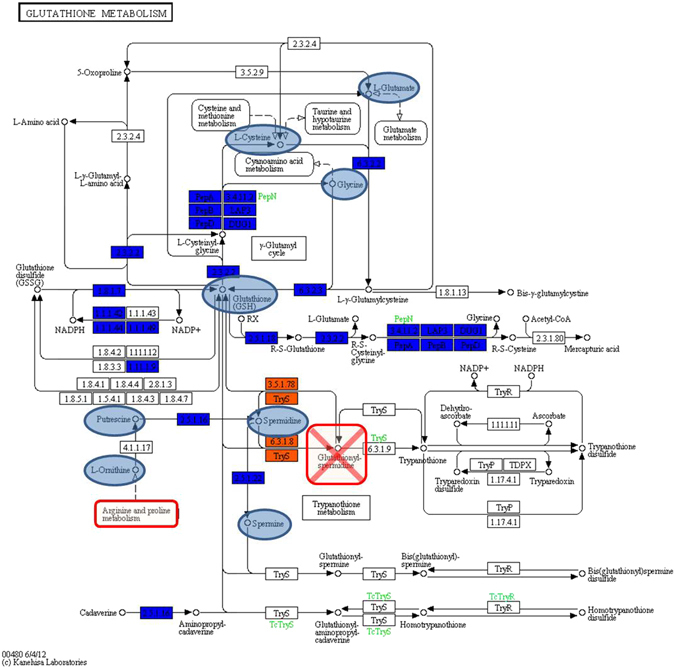
Figure 6.

Glutathione (GSH) metabolic network analysis using the dape module (KEGG map00480, reproduced with permission of Kanehisa Laboratories, Japan). Boxes represent reactions while small circles represent compounds. Core reactions are colored blue, variable reactions are colored orange; blue circles represent compounds better used by PhTAC125 at 4 °C, compared to PspTB41. The orange reactions indicates that PspTB41 is not able to carry out reactions catalyzed by glutathionylspermidine amidase/synthetase (3.5.1.78) and glutathionylspermidine synthase (6.3.1.8), resulting in its inability on producing glutathionylspermidine and S-thiolation. Gluathione metabolism is strictly related to ‘Arginine and Proline metabolism’.
