
Figure 1.
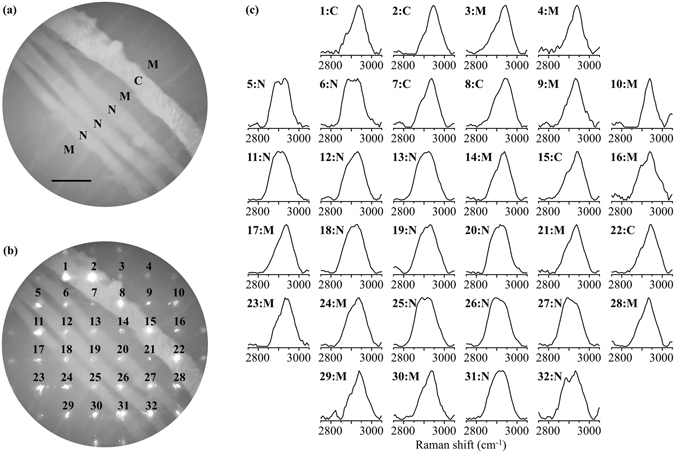
(a) Bright-field image of a test sample containing bundles of peripheral nerve fibers (N), connective tissue (C), and a skeletal muscle tissue (M). The scale bar is 1 mm. (b) Bright-field image of the sample together with multiple excitation laser irradiation spots. (c) Raman spectra obtained at the laser spots seen below numbers in (b). The signal accumulation time was 5 seconds. N, C, and M indicate the tissue type at each spot position. The arrowheads indicate two characteristic bands at 2895 and 2931 cm−1. The spectra were preprocessed.