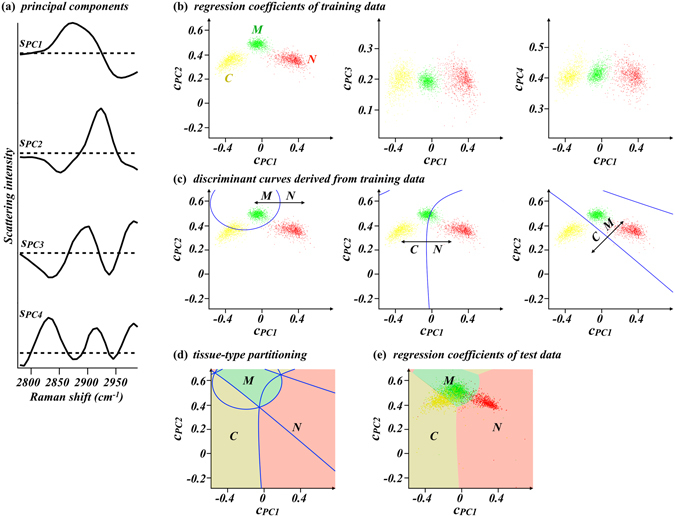
Figure 2.

(a) The first to fourth principal components of training dataset composed of 1000 peripheral nerve spectra, 1000 connective tissue spectra, and 1000 skeletal muscle tissue spectra (s PC1 to s PC4). Horizontal dashed lines indicate zero intensity for individual principal components. (b) Principal component regression coefficient plots of the training spectra. c PC1, c PC2, c PC3, and c PC4 are regression coefficients to the four principal components shown in (a) (s PC1, s PC2, s PC3, and s PC4, respectively). (c) Discriminant curves discriminating the Raman spectra groups of peripheral nerve from skeletal muscle tissues (left), peripheral nerve from connective tissues (middle), and connective tissues from skeletal muscle tissues (right) in the space of c PC1 to c PC2 plot. (d) A graph overlaying all the discriminant curves in (c) and three distinct areas assigned to nerve-positive prediction region (light red), connective-tissue-positive prediction region (dark yellow) and muscle-positive prediction region (light green). Individual areas were derived from the M/N and C/N discrimination curves, the C/N and C/M discrimination curves, and the M/N and C/M discrimination curves in (c), respectively. (e) Results of principal component regression of the 3840 test spectra with the four principal components shown in (a). The tissue-type partitions are overlaid. N: peripheral nerve bundle. C: connective tissue. M: skeletal muscle tissue.
