
Figure 3.
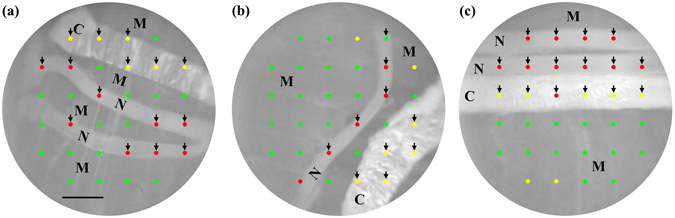
Representative results of tissue-type mapping overlaid with bright-field images. Colored circular spots exhibit Raman measurement points, that is, tissue-type discrimination points. At red, yellow, and green points, tissues are discriminated as peripheral nerve bundle, connective tissue, and skeletal muscle tissue, respectively. The scale bar is 1 mm. N, C and M denote myelinated nerve bundle, connective tissue and skeletal muscle tissue, respectively.