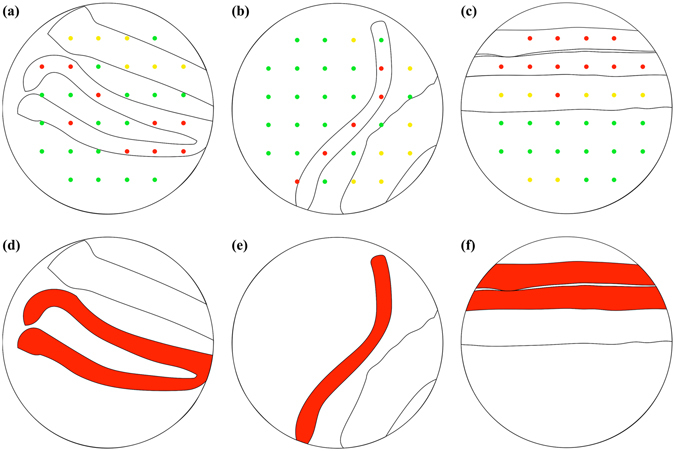
Figure 5.

Visualizing the nerve bundles by morphology-highlighted images, the tissue type maps, and the nerve detection criterion on the N N/N total. (a–c) The overlay of morphology-highlighted images, and tissue type maps of samples shown in Fig. 3. At red, yellow, and green points, tissues are discriminated as peripheral nerve, connective, and skeletal muscle tissues, respectively. (d–f) The nerve bundles highlighted in red according to the nerve detection criterion of N N /N total = or >0.4.
