Figure 3.

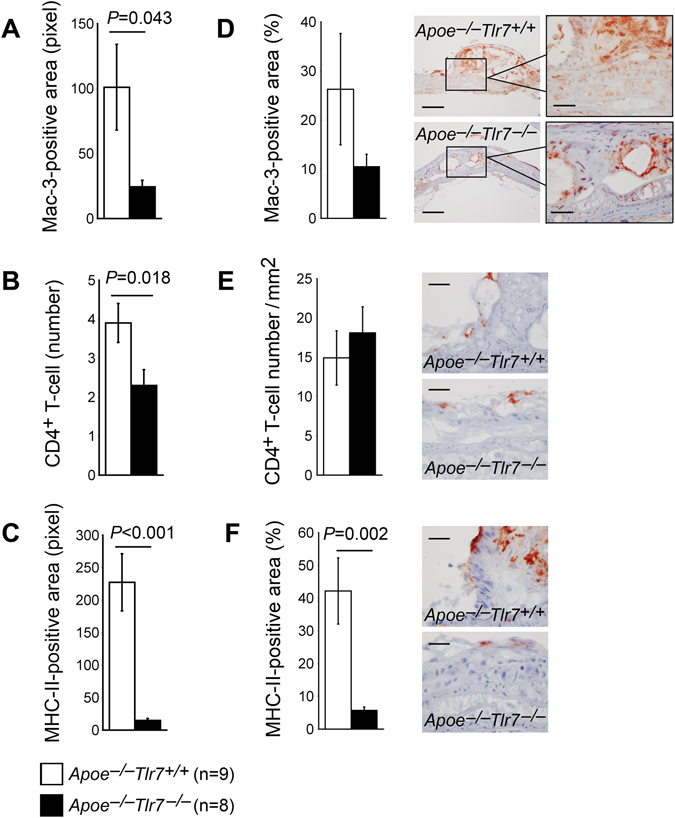
TLR7 deficiency and aortic arch atherosclerotic lesion inflammatory cell accumulation in male Apoe −/− mice. (A) Mac-3-positive area in pixel. (B) Lesion CD4+ T-cell number. (C) Lesion MHC class-II-positive area in pixel. (D) Mac-3-positive area versus total lesion area in percentage. Representative images are shown to the right. Scale: 200 µm, inset scale: 100 µm. (E) Lesion CD4+ T-cell number per mm2. Representative images are shown to the right. Scale: 100 µm. (F) Lesion MHC class-II-positive area versus total lesion area in percentage. Representative images are shown to the right. Scale: 100 µm. Numbers and genotypes of mice are indicated in the legends.
