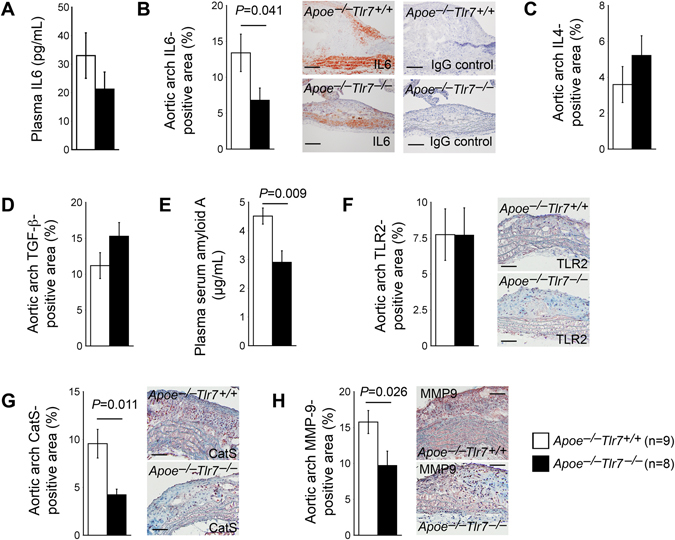
Figure 4.

TLR7 deficiency changes aortic arch atherosclerotic lesion inflammatory cytokine and protease expression in male Apoe −/− mice. (A) Plasma IL6 level. (B) Lesion IL6-positive area percentage. Representative images are shown in the middle panels. Rabbit IgG isotype control staining results from parallel sections are show in the right panels. Scale: 200 µm. (C) Lesion IL4-positive area percentage. (D) Lesion TGF-β-positive area percentage. (E) Plasma SAA level. Lesion TLR2-positive area (F), CatS-positive area (G), and MMP-9-positive area (H) percentages. Representative images are shown to the right panels. Scales: 100 µm. Numbers and genotypes of mice are indicated in the legends.
