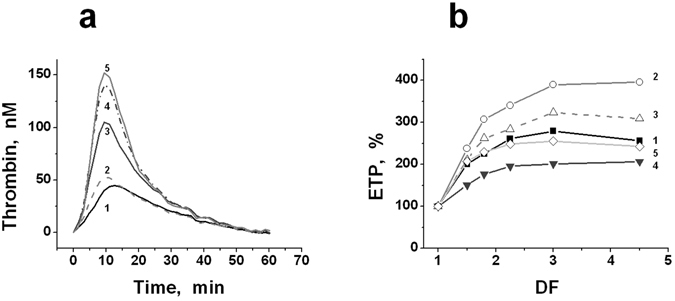
Figure 2.

Thrombin generation in plasma diluted with PEs. (a) – The curves of thrombin generation in plasma diluted with NS (one of the typical experiments). The values of DF were equal to: (1) – 1.025 (plasma, practically undiluted); (2) – 1.5; (3) – 2; (4) – 3; (5) – 4. (b) – The typical dependencies of ETP (in %) versus DF obtained in one of the experiments for plasma diluted with different PEs (see legend to Fig. 1): (1) – NS; (2) – RPG; (3) –HES; (4) – GF; (5) – ALB. DF (a dilution factor) is equal to the ratio of the final volume of diluted plasma to its initial volume.
