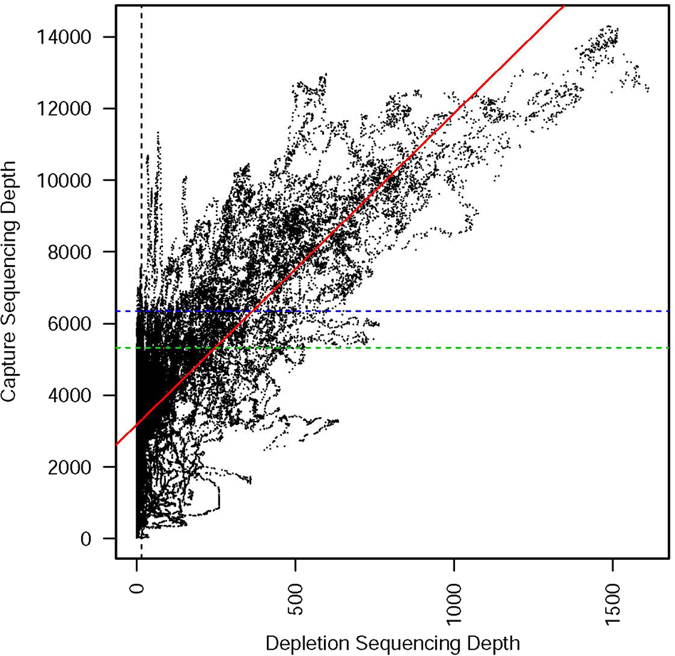
Figure 2.

Scatterplot of Sequencing Depth Measurements for Capture and Depletion Data. The sequencing depth values for the capture data and the depletion data are plotted for every position in the reference genome. As expected, there is a positive linear correlation between the two values (red line, p-value: <2e-16, R-squared = 0.307). Our thresholds for predicting nuwts are overlaid on this plot with 16X sequencing depth being the previously established17 threshold for the depletion data (black dotted line) and the second and third standard deviations from the mean being the thresholds for the capture data (green and blue dotted lines, respectively).
