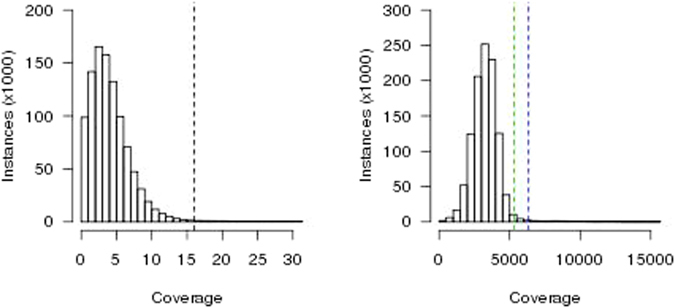
Figure 3.

Sequencing Depth Histograms. Histograms of the instances, in increments of 1000, of a given sequencing depth upon calculating sequencing depth for every position in the genome are shown for (A) the depletion data published in Ioannidis et al.17 and (B) the capture data published in Geniez et al.31. In panel A, the previously established17 threshold for predicting a nuwt in the depletion data is shown with a dashed black line. In panel B, the second and third standard deviations from the mean are shown with dashed green and blue lines, respectively.
