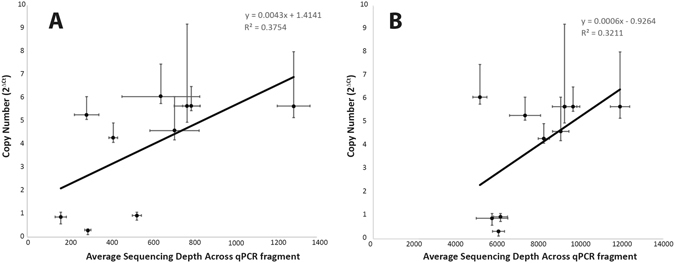
Figure 4.

Correlation Between Previous qPCR Results and Sequencing Depth of the Capture Data. For ten genes, the average sequencing depth across a fragment amplified by qPCR is compared to the previously measured17 copy number, measured by the ΔCt of the qPCR reaction relative to the average Ct value of six single copy B. malayi genes, for the depletion data17 (Panel A,) and the capture data (Panel B). The error bars for the copy number are derived from one standard deviation of the ΔCt, making them asymmetric since copy number is exponentially related to ΔCt. The error bars for the average sequencing depth are one standard deviation. A comparison of the plots for the capture data presented here and the previously presented depletion data reveals similar R2 values but different y-intercepts and slopes. A lower y-intercept is expected for the capture data relative to the depletion data since it will be altered by the presence of the sequencing reads from the endosymbiont genome. A different slope is expected due to the differences in the sequencing depth.
