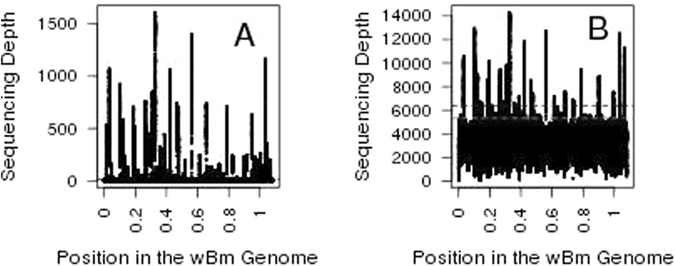
Figure 5.

Sequencing Depth Across the wBm genome. The sequencing depth is plotted for each position along the wBm genome for the depletion data (Panel A) and the capture data (Panel B). Multi-copy nuwts are the highest peaks in sequencing depth. The thresholds for detecting sequencing depth are overlaid (16-fold cutoff for depletion data, red dotted line in Panel A, and two and three standard deviation cutoffs in the capture data, green and blue dotted lines, respectively, in Panel B). The dynamic range between the sequencing depth across multi-copy nuwts relative to the average sequencing depth across the genome is lower in the capture data than in the depletion data. Where the dynamic range is larger, as in the depletion data, it is much easier to detect nuwts, particularly lower copy number nuwts, demonstrating the utility of depleting of Wolbachia when possible.
