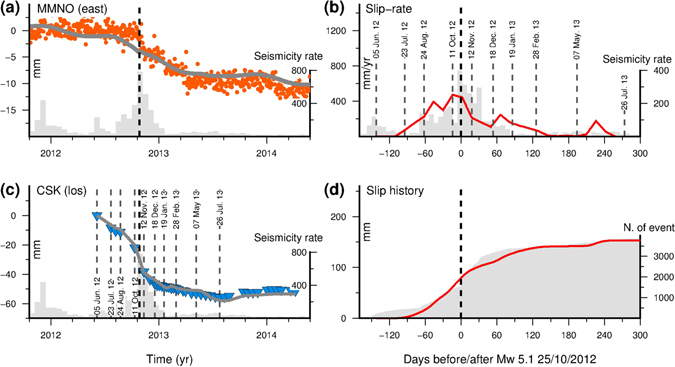
Figure 2.

Geodetic time series, aseismic slip and seismicity rate. (a) Orange dots indicate the E-W (longitude) daily displacement recorded at GPS site MMNO in the Apulia (Ap) reference frame. The grey line is the prediction from the best-fit time dependent model of the aseismic transient slip event. The black dashed line indicates the 25 October 2012 M W 5.1 main event. Histogram bars in panels (a) and (c) show the number of seismic events in 16-day intervals, while in panel (b) in 8-day intervals. The complete set of the GPS time series are in the Supplementary Material. (b) Best-fit aseismic slip rate estimated from the time dependent inversion (red line). Labelled dashed vertical lines indicated selected CSK acquisition epochs. (c) Blue triangles indicate the CSK light-of-sight (LOS) displacement observed in the area of maximum deformation (i.e., between MMNO and VIGG sites), while grey line is the prediction from the best-fit model. The transient event is clearly visible between July 2012 and the first half of 2013. (d) Evolution of cumulative aseismic slip (red line) and cumulative number of seismic events (grey area). The figures were created by using Generic Mapping Tools software (GMT v4.5.14; http://gmt.soest.hawaii.edu/)53.
