
Figure 3.
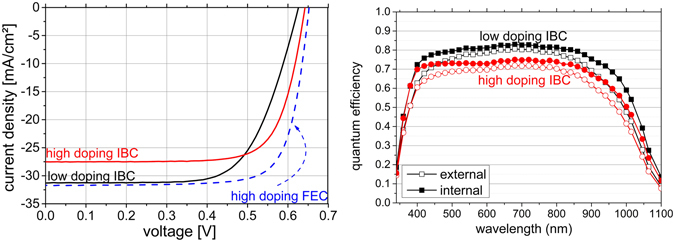
(a) J−V curves of the best IBC cells on LPC absorbers with high (red) and low (black) doping, respectively. The best FEC structure (blue) is added to demonstrate the potential of the absorbers. (b) External (open symbols) and internal (closed symbols) QE of the high (circles) and low (squares) IBC cells in 3a). FEC structure is omitted to not overload the graphic. J SC determined from integrating EQE curves corresponds well within errors with solar simulator data.