
Figure 4.
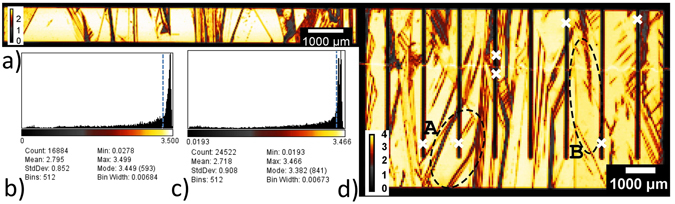
(a,d) LBIC recordings (λ = 638 nm) and (b,c) histogram of all measured pixel values. (a,b) FEC structure (25 μm step), (c,d) IBC cell (50 μm step). Areas of reduced collection stem from absorber contact area (regular pattern) or GB and dislocations. The bright line at about two thirds height of IBC image (d) is a measurement artifact from an irregularity in the glass not affecting performance. White crosses mark locations where local effective diffusion lengths were fitted from line-scans. Dashed ellipses mark areas for comparison to EL and microscope images in Fig. 6. Values above blue dashed lines in (b,c) mark values that were used for current loss evaluation.