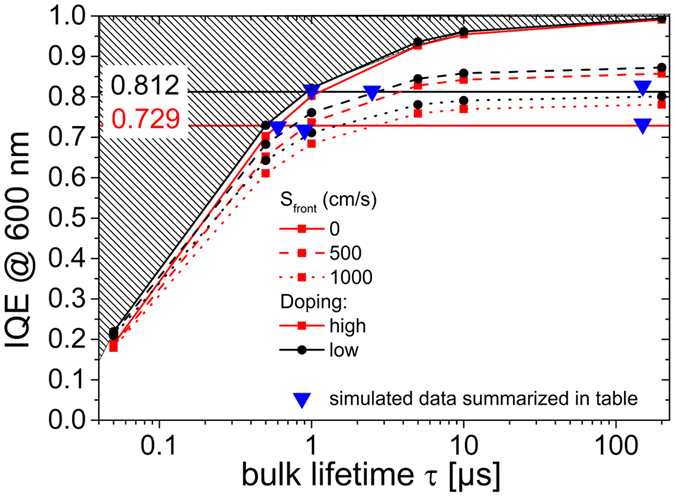
Figure 7.

Simulated IQE at 600 nm of high (red squares) and low (black circles) doping IBC structures that were implemented into ASPIN3 as a function of bulk lifetime. IQE were simulated for different front surface recombination velocities (solid lines: 0 cm/s, dashed: 500 cm/s, dotted: 1000 cm/s). Measured IQE values at 600 nm of the two IBC cells from Fig. 3 are implemented as horizontal lines. Hatched area above the 0 cm/s lines is outside the parameter space for valid solutions for any set of lifetime and recombination velocity to reach an IQE value in this area. Face-down triangles represent simulated cells with IQE matching the ones measured for the three cases: bulk limited, intermediate and interface limited in Table 4.
