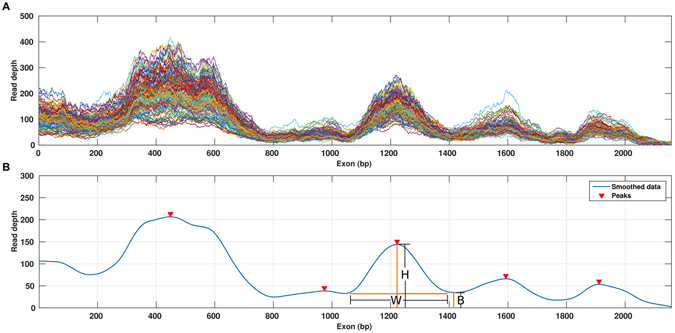
Figure 2.

Characterizing the coverage distribution with the Unevenness (UE) score. (A) The coverage distribution from multiple samples is plotted against the exon length. (B) The smoothed median coverage plotted against the exon length, obtained by first calculating median coverage for each position and then using LOWESS smoothing. Peaks and troughs were then identified by using a local optimization algorithm. Arrows indicate peaks identified in the curve: B, base, W, width and H, height of the peak, LR, length of the region analyzed.
