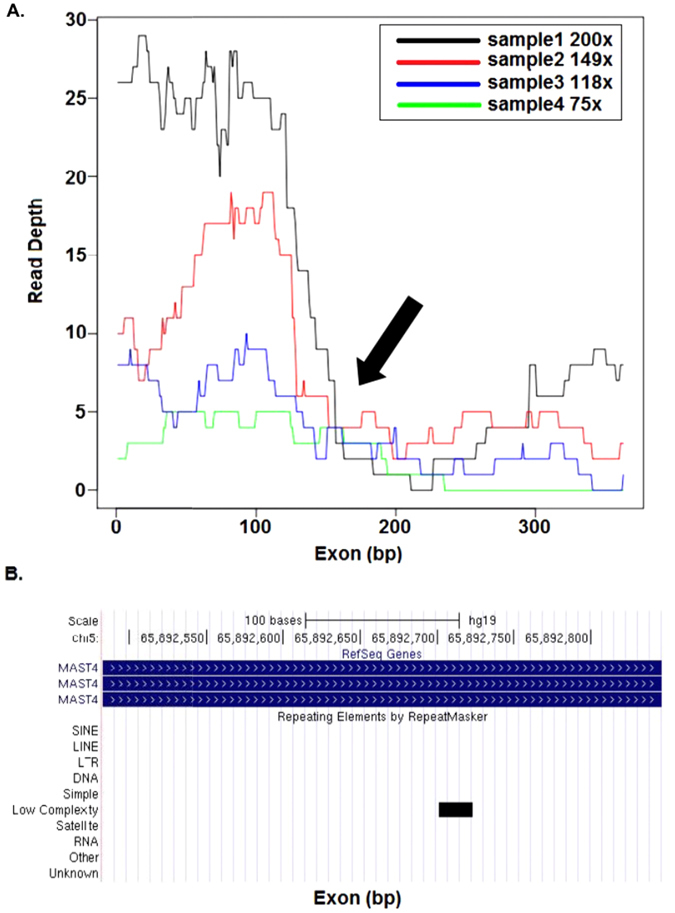
Figure 5.

Concurrence of repeat elements and coverage sparseness. (A) Base coverage distribution along the length of the first coding exon of MST4. WES samples from the NimbleGen platform with different average coverage ranging from 75X to 200X are shown in different colors. Arrow indicates the point at which coverage falls sharply. (B) UCSC browser screen shot of MST4 genomic region, black bar indicates the position of the repeat element.
