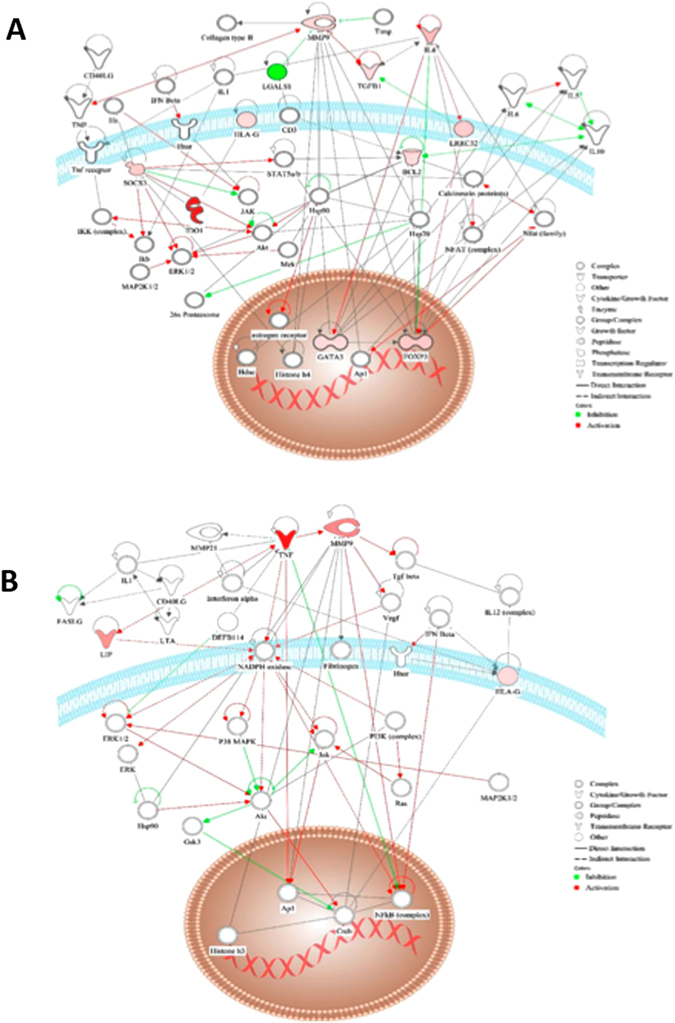
Figure 9.

Network for T cells and AdMSC correlated gene upregulation in assays with high suppressive activity. (A) Representative network built, using IPA software, for the genes or “focus molecules” that presented positive correlation in gene expression with IL-4 in T cells, only in the assays with highly suppressive AdMSC. (MMP9, LGALS1, LRRC31, SOCS3, TGFB1, BCL2, CCR8, FOXP3, GATA, HLAG and IDO). (B) Representative network built, using IPA software, for the genes or “focus molecules” that presented positive correlation in gene expression with TNF in AdMSC, only in the assays in which AdMSC presented high suppressive activity. (MMP9, HLAG and LIF). The network is represented in a subcellular layout, placing the nodes into a view of subcellular compartments. The genes are represented in graduation of red and green based on their fold change in expression. The white open nodes indicate molecules not identified in this analysis, but associated with the regulation of some of the genes analyzed. The green edges represent inhibition and red, activation.
