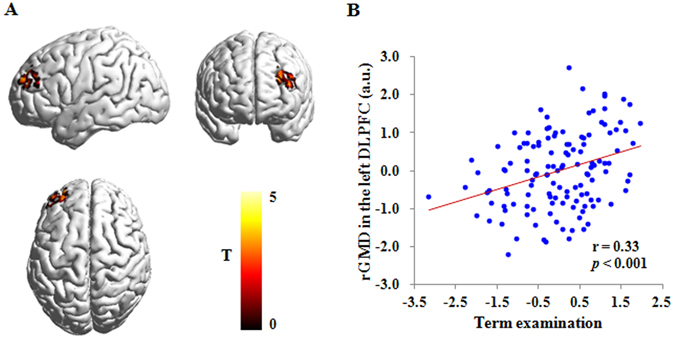
Figure 2.

Brain regions that are related to term examination. (A) Brain images showing the positive association between the rGMD of the left DLPFC and term examination. (B) Scatter plot depicting the correlation between term examination and the rGMD of the left DLPFC (r = 0.33, p < 0.001). The score of horizontal axis represents the standardized residual of the term examination score (average standardized score of nine curriculum subjects) after adjusting for age, gender and total gray matter volume. The score of vertical axis represents the standardized residual of the rGMD in the left DLPFC after adjusting for age, gender and total gray matter volume. The color bar represents the Student’s T-test (T) scores in each voxel, 0 represents the minimum T score and 5 represents the maximum T score. rGMD = regional gray matter density; DLPFC = dorsolateral prefrontal cortex; a.u. = arbitrary unit.
