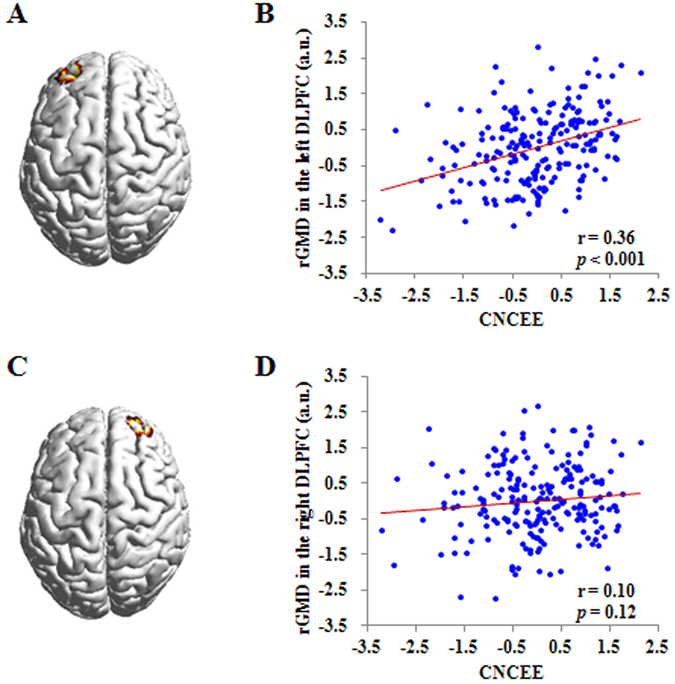
Figure 3.

Correlation between CNCEE and the rGMD in the left DLPFC and right DLPFC. (A) Brain image showing the spherical region of interest (ROI, radius = 10 mm) in the left DLPFC, which was created by using the coordinate of peak (−30, 58, 28) in the significant region related to CNCEE from the whole-brain regression analyses. (B) Scatter plot depicting the correlation between CNCEE and the rGMD of the left DLPFC (r = 0.36, p < 0.001). The score of horizontal axis represents the standardized residual of the CNCEE score (average standardized score of four curriculum subjects) after adjusting for age, gender and total gray matter volume. The score of vertical axis represents the standardized residual of the rGMD in the left DLPFC after adjusting for age, gender and total gray matter volume. (C) Brain image showing the spherical ROI (radius = 10 mm) in the right DLPFC, which was created by using the coordinate of peak (30, 58, 28) in contrast to the left DLPFC. (D) Scatter plot depicting the correlation between CNCEE and the rGMD of the right DLPFC (r = 0.10, p = 0.12). The score of horizontal axis represents the standardized residual of the CNCEE score (average standardized score of four curriculum subjects) after adjusting for age, gender and total gray matter volume. The score of vertical axis represents the standardized residual of the rGMD in the right DLPFC after adjusting for age, gender and total gray matter volume. rGMD = regional gray matter density; DLPFC = dorsolateral prefrontal cortex; a.u. = arbitrary unit; CNCEE = Chinese National College Entrance Examination.
