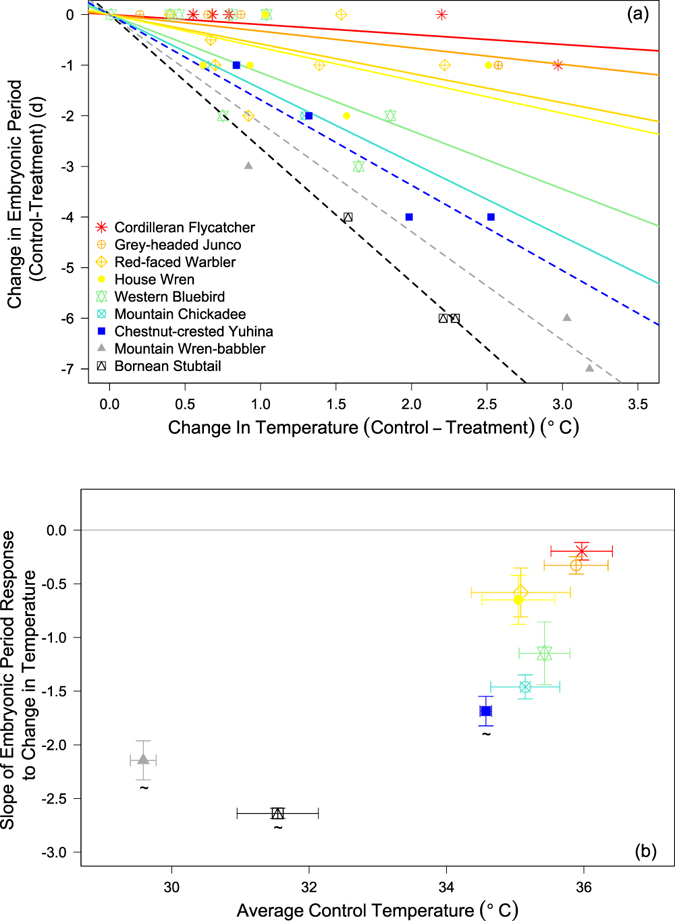
Figure 2.

(a) Correlation between measured differences in egg temperature, and incubation period differences between treatment and control among 42 paired nests belonging to nine species at two latitudes. Each point represents a nest pair and each symbol and color a different species. Individual regression lines provide the intraspecific response of embryonic period to experimental heating and warmer colors are associated to warmer natural incubation temperature. Dashed lines denote tropical species. Names in figure legend are reported in order of ascending slope. (b) Correlation between average (±1 SE) differences in control incubation temperature and change of embryonic period with treatment temperature (slope ±1 SE) for nine songbird species at two latitudes. Tropical species are denoted as ~. The gray horizontal line intercepting zero represents the physiological threshold for development where further temperature increases produces no changes in embryonic period.
