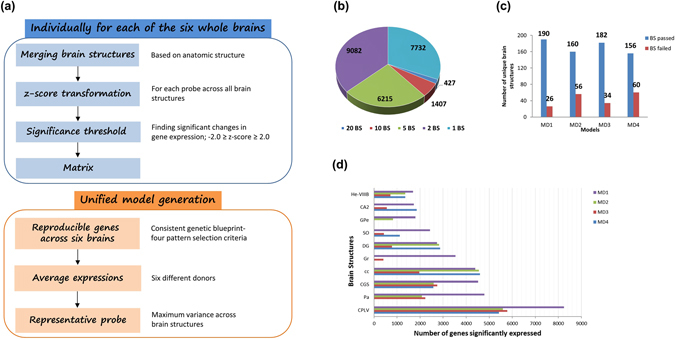
Figure 1.

(a) Schematic of the building gene expression profile models for the healthy adult human brain. (b) Distribution of reproducible gene expression patterns across distinct brain structures for expression profile model, MD1. (c) Number of unique brain structures (BS) that pass or fail the gene expression pattern selection criteria for models, MD1 to MD4. (d) Brain structure based gene enrichment. Top ten brain structures with highest number of genes showing significant and differential expression across four models.
